Evidence Synthesis With Tables and Figures in a Review Article
Use a table when a review synthesis depends on exact values or aligned comparison of repeated study attributes; use a figure when the main task is to perceive a trend, process, pattern, or relationship. In both cases, the visual should stay aligned with the review question, preserve the strength of the underlying evidence, and add analytical value rather than duplicate the prose.
Choose the right synthesis visual
Match the reader's main information task to the representation, then keep the visual, evidence, and narrative doing different but connected jobs.
Use a table
Best for
Aligned cross-study comparison, exact values, and repeated attributes.
Structure
Studies as rows; comparable attributes as columns when that arrangement fits the review question.
Include
Study identity, purpose, methods, key findings, plus only the sample, context, appraisal, or review-specific fields that affect interpretation.
Narrative role
Interpret the similarities, differences, and implications that matter instead of restating cells.
Use a figure
Best for
Trends, patterns, processes, sequences, contrasts, and conceptual relationships.
Structure
Show only constructs, categories, stages, or connections needed to express the supported synthesis claim.
Predicate rule
An association stays an association; direction or causality should appear only when the evidence supports it.
Narrative role
Explain the meaning, limitations, and argumentative relevance of the pattern rather than repeat labels.
Define the analytical claim.Decide what the reader must compare, retrieve, or perceive.
Encode the evidence faithfully.Use comparable fields or supported relationships without strengthening the claim.
Interpret without duplicating.Let the visual carry structured evidence and let prose explain why it matters.
The sections below move from choosing the appropriate form to building comparable tables, designing defensible figures, integrating visuals with prose, and checking whether each visual earns its place.
Table of Contents⌄
Choose Between a Table and a Figure Based on the Synthesis Task
Use a table when the synthesis task requires precise comparison of aligned details or retrieval of exact values; use a figure when the reader needs to perceive trends, patterns, processes, or relationships.
In mixed cases, the analytical claim determines which representation should carry the evidence.
Neither form is inherently superior because each supports a different information task.
The comparison below applies five shared criteria—purpose, data density, precision, pattern visibility, and interpretive burden—to connect the information property of the evidence with a suitable form.
Criterion
Table
Figure
Purpose
Supports aligned comparison and retrieval of specific details.
Supports recognition of trends, patterns, processes, or relationships.
Data density
Accommodates repeated attributes when readers need to inspect individual cells.
Condenses evidence when the analytical claim concerns an overall configuration rather than retrieval of each individual value.
Precision
Preserves exact values and categorical details for direct verification.
Emphasizes relative position, direction, sequence, or relationship when exact-value retrieval is secondary.
Pattern visibility
Requires readers to infer a pattern by comparing entries across rows or columns.
Makes a pattern or relationship directly perceptible when it can be represented graphically.
Interpretive burden
Places the comparison task on the reader when relationships must be inferred from multiple entries.
Reduces the need to scan individual entries when the analytical claim concerns an overall pattern, while requiring the graphical relationship itself to be interpreted.
For example, the same reviewed studies may justify a table when the analytical claim depends on checking exact values across studies, but a figure when the claim concerns the direction or pattern those values form together.
The analytical claim therefore governs which representation fits the synthesis task.
The accompanying illustration can show the shift between exact-detail retrieval and recognition of an overall evidence relationship without repeating the comparison criteria.
Use Tables for Structured Cross-Study Comparison and Exact Details
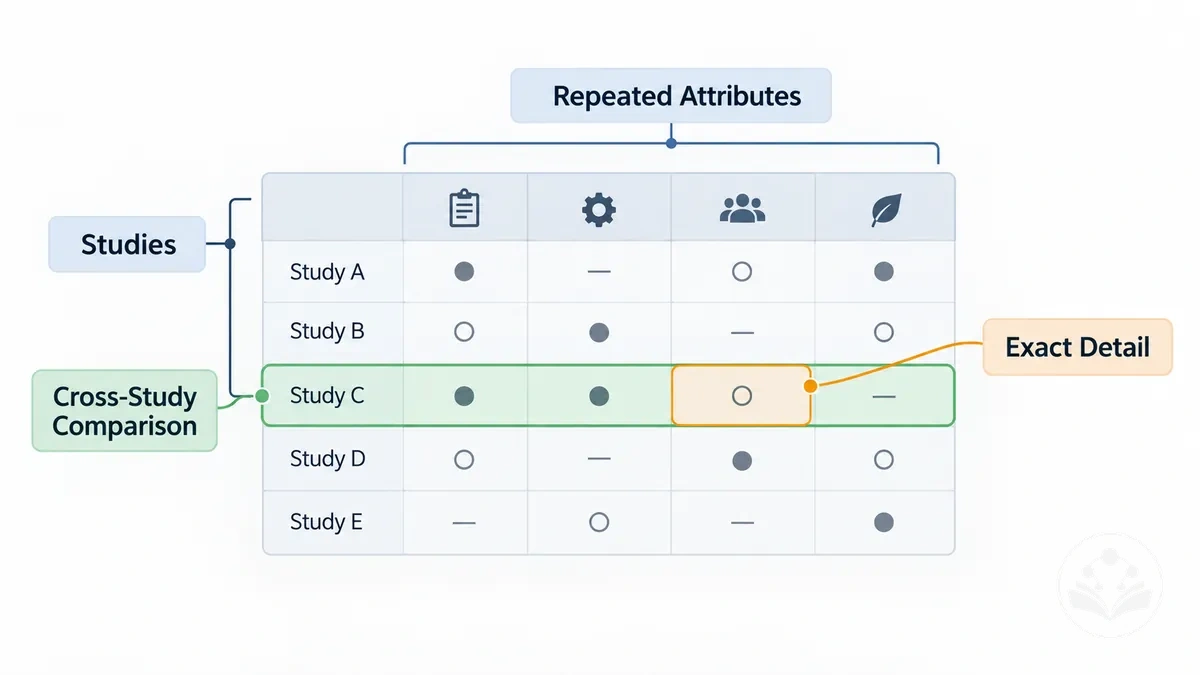
Tables are most useful when readers need to inspect exact details or make a cross-study comparison of the same attributes across studies.
By aligning repeated attributes in rows and columns, tables preserve precision and make differences in study characteristics, methods, findings, and exact values easier to verify.
A figure is preferable when the main information task is perceiving a trend or relationship rather than retrieving precise details.
The annotated example demonstrates how generic study rows and a small set of repeated attribute columns support aligned comparison and exact-detail lookup without presenting real study findings.
Tabular presentation is particularly useful when comparable fields recur across the reviewed studies and readers need to locate or verify specific information.
Conditions that favour a table include:
Study characteristics need to be compared across sources using the same repeated attributes.
Methods need to remain aligned so methodological differences can be identified without reconstructing them from narrative prose.
Findings include exact values or categorical details whose precision matters to the synthesis claim.
Repeated attributes need cell-level lookup so readers can verify where studies agree or differ.
Use Figures for Trends, Processes, and Conceptual Relationships
Figures are useful when evidence synthesis depends on the reader perceiving trends, processes, or conceptual relationships that are harder to infer from aligned details alone.
They make patterns, sequences, and connections among constructs visible, while the interpretation of each represented relationship remains constrained by the reviewed evidence.
These three figure functions support different information tasks:
Trend: represents a direction or pattern across comparable evidence so the reader can interpret how observations vary across studies, groups, conditions, or time where the evidence supports that comparison.
Process: depicts stages, sequence, or flow so the reader can follow how elements are ordered or connected through a process supported by the reviewed evidence.
Conceptual relationship: maps connections among constructs so the reader can interpret how concepts are associated or organised within the reviewed evidence.
The represented relationship must remain traceable to the reviewed evidence.
An observed association should remain an association, while a sequence or conceptual connection should not be interpreted as a causal relationship unless the evidence supports that interpretation.
Build an Evidence Synthesis Table Around Comparable Study Attributes
An evidence synthesis table should be designed around the review question and comparison purpose, using study attributes that can be applied consistently across the included studies rather than every extracted detail.
Each study can occupy a row while columns represent comparable fields whose recorded values or states contribute to synthesis.
Before building the table, organize evidence so the selected fields remain connected to the review question and can expose meaningful similarities, differences, or gaps.
Core comparable fields should support comparison across studies, while review-specific fields should be included only when they contribute directly to the analytical purpose.
Build the table in sequence so each decision supports consistent cross-study comparison.
Verify the purpose and field logic at each stage before adding more detail.
Define the comparison purpose. State what the evidence synthesis table needs to reveal in relation to the review question; check that the intended comparison can be expressed through study-level rows and comparable columns.
Select comparable attributes. Choose study attributes that support the comparison purpose, separating broadly comparable fields from review-specific fields; check that each selected field contributes to synthesis rather than note storage.
Normalize labels and categories. Use consistent labels and categories for equivalent concepts across studies; check that the same category represents the same type of value or state wherever it appears.
Populate the table consistently. Record each study's value, state, or finding under the corresponding columns; check that equivalent information is placed in equivalent fields across rows.
Verify interpretability. Compare the completed rows and columns to confirm that similarities, differences, and gaps can be identified without reconstructing the source notes; revise fields that do not contribute to that interpretation.
The resulting table should make the relationship between each study, selected attribute, recorded value or state, and cross-study implication visible.
A synthesis table is analytically useful when its comparable fields support interpretation of findings rather than simply archive extracted information.
Fields that cannot be interpreted consistently across studies should be qualified, redefined, or omitted when they do not support the review question.
The accompanying image illustrates the progression from organized study evidence to aligned attributes and an interpretable cross-study comparison without prescribing a universal table structure.
Include Study Identity, Purpose, Methods, and Key Findings
Study descriptors in a synthesis table identify each study and provide comparable fields for interpreting its contribution to the review.
Core descriptors usually include study identity through author and year or an equivalent source identifier, the study purpose or research question, methods or design, and key findings.
Consistent descriptors help readers distinguish studies and compare what each study examined, how it was conducted, and what it found.
The annotated image labels these core descriptors and their analytical functions without implying that the same fields apply to every review.
Study identity: Author and year, or an equivalent identifier, identifies the source represented by the row.
Purpose: The study aim or research question describes what the study investigated and supports comparison of research focus.
Methods: The design or method describes how the study addressed its purpose and helps contextualize differences in findings.
Sample or context: When relevant to the review question, the sample, setting, population, or study context helps explain the conditions under which findings were produced.
Key findings: The findings field records the results most relevant to the review question so evidence can be compared across studies.
Quality or appraisal: Quality or appraisal information belongs in the synthesis table when the review method uses it to interpret or differentiate the included evidence.
Sample and context are conditional fields because their analytical value depends on whether population, setting, or other study characteristics affect the comparison required by the review question.
Quality or appraisal information is also conditional and should be included when appraisal forms part of the review method, rather than as a default descriptor.
The appropriate level of detail should remain consistent enough for comparison without expanding into exhaustive bibliographic information.
Each field should identify, describe, contextualize, or record information that has a clear analytical use in the synthesis.
Add Review-Specific Attributes That Expose Patterns and Differences
Review-specific attributes should be added only when they help answer the review question or expose a meaningful cross-study pattern.
A candidate attribute contributes to synthesis when its available study value, state, or category enables comparison that changes interpretation of themes, context, or findings.
An attribute with no clear analytical purpose adds descriptive detail without improving the synthesis.
Evaluate candidate attributes in order from relevance to interpretive value.
Relevance: The attribute passes this criterion when it directly contributes to answering the review question or distinguishing a theme, context, or finding category; if it does not affect the analytical purpose, it does not justify an additional column.
Comparability: The attribute is useful when studies report values, states, or categories that can be meaningfully compared; incompatible information should not be treated as equivalent without qualification.
Consistency: The attribute supports comparison when equivalent values or categories can be represented at a consistent level of granularity across studies; inconsistent definitions, units, or category boundaries limit the patterns that can be inferred.
Interpretive value: The attribute deserves a column when differences in its values or states expose a pattern or implication relevant to the synthesis; a field that merely records detail without changing comparison or interpretation has low analytical value.
The usefulness of review-specific attributes therefore depends on the review question, the information available across studies, and whether that information remains comparable and consistent.
An attribute can be relevant but still unsuitable for cross-study comparison when studies report incompatible categories or levels of detail.
Conversely, a consistently reported context or finding category can add interpretive value when its variation distinguishes a pattern across the evidence.
For example, a context field that separates findings across relevant settings may contribute to interpretation, whereas a descriptive detail that does not change the comparison remains non-essential.
Create Figures That Express Synthesized Relationships
A synthesis figure should begin with an evidence-supported synthesized relationship or evidence pattern, not with a preferred visual style.
The analytical claim should determine which constructs, categories, stages, connections, or sequence the figure needs to represent.
After you synthesize studies, map only the relationships supported by the reviewed evidence into the figure.
The visual form should clarify the synthesis without strengthening an association into an unsupported causal claim.
Build the figure in a linear sequence from claim selection to verification.
Each step should preserve the connection between the analytical claim, the evidence pattern, and the interpretive implication.
Identify the analytical claim. State the synthesis claim the figure must communicate; verify that it is supported by the reviewed evidence rather than inferred from visual preference.
Define the synthesized relationship. Identify the relevant constructs, categories, stages, connections, or sequence; verify that the relationship type matches the strength and direction of the evidence.
Map evidence to visual elements. Assign the supported entities or concepts to labels, positions, and connections; verify that each visual element corresponds to evidence rather than an invented relationship.
Simplify non-essential detail. Keep the elements needed to express the evidence pattern and analytical claim while omitting detail that does not change interpretation; verify that simplification does not erase an important condition or limitation.
Verify fidelity. Compare the completed figure with the reviewed evidence and confirm that its labels, connections, and sequence support the intended interpretation without implying more than the studies establish.
An analytically defensible figure keeps every represented relationship traceable to the reviewed evidence and makes relevant limitations clear through appropriate qualification.
Simplification is useful only when it preserves the evidence pattern and does not convert uncertainty, association, or sequence into a stronger claim.
Connections between constructs should reflect the level of support available rather than suggest an unsupported mechanism.
Verification closes the process by checking that the figure communicates the synthesis claim faithfully and no more strongly than the evidence permits.
Define the Pattern, Process, or Relationship the Figure Must Explain
The relationship the figure explains should be stated explicitly before any visual encoding begins.
Identify the relevant constructs, categories, stages, or variables, then state the pattern, process, or relationship that the reviewed evidence supports.
The relationship statement should specify whether the claim concerns an association, sequence, contrast, or conceptual proposition so the visual representation does not imply a stronger connection than the evidence warrants.
Match the relationship to the claim
The relationship statement sets the predicate strength the figure can communicate.
Association
Constructs or categories are related or co-occur; this does not assert that one causes the other.
Sequence
Stages or events follow an evidenced order; order alone does not establish a causal mechanism.
Contrast
Categories or conditions differ on a relevant attribute supported by the synthesis.
Conceptual proposition
Constructs are proposed to relate in the way the synthesis supports, with any necessary qualification retained.
Causal relation
Use causal wording or directional connectors only when the evidence supports a cause-and-effect claim; association or co-occurrence alone is insufficient.
Keep Labels and Connections Consistent With the Reviewed Evidence
Every label and connection in a figure should preserve the terminology and relationship strength supported by the reviewed evidence.
Labels, legend entries, and categories should match the concepts used in the synthesis rather than introduce decorative relabeling or inconsistent terminology.
Arrows and lines should represent only the stated relationship, while units, groups, and stages should remain unambiguous where they are relevant to interpretation.
A visual cue should not strengthen an association, difference, or sequence beyond what the evidence supports.
No visual element should imply a meaning or evidential strength beyond what the reviewed evidence supports.
Integrate Tables and Figures With the Review Narrative
Tables and figures carry structured visual evidence; the narrative explains what that evidence means for interpretation and the analytical argument.
A table can hold exact details that readers may need to inspect, and a figure can make a pattern or relationship easier to perceive.
The prose should then explain the significance of those details or patterns rather than repeat them.
This division of informational labour gives each representation a distinct role.
Use the visual for information that benefits from structured comparison, precise lookup, or pattern recognition, and use prose to explain why that evidence matters for the review question.
A reference to a table or figure should appear where the analytical point is being made, so it directs attention to relevant visual evidence and then interprets that evidence within the argument.
The amount of exact detail repeated in prose should depend on what the visual already communicates and what the interpretation requires.
Broader decisions about where these elements sit within the article belong to how you structure the manuscript, but their local function remains to support the surrounding analysis rather than interrupt it.
Integration sequence
Introduce the analytical point.State the comparison, pattern, or relationship the argument is addressing.
Reference the visual at the point of use.Direct the reader to the table or figure when its evidence is needed, not merely where it happens to appear.
Interpret what matters.For a table, identify the significant similarities or differences; for a figure, explain the meaning of the relevant pattern or relationship.
Advance the argument.Let the visual retain structured detail while the prose adds significance, qualification, and the next analytical implication.
Refer to Each Visual Where It Advances the Analytical Argument
A table or figure should be referenced in the narrative where its visual evidence supports a specific analytical claim, not merely where the visual appears.
The reference should direct attention to the evidence needed for a comparison, pattern, or relationship and make its analytical purpose clear.
A table reference can focus attention on exact details relevant to a comparison, while a figure reference can highlight a pattern that contributes to the argument.
The surrounding sentence should connect the visual evidence to the interpretation being developed.
Reference the evidence, not just the location
Location only
See the table.
This identifies where the visual is but does not explain why its evidence matters to the argument.
Analytical reference
The table highlights differences across the reviewed studies that are relevant to this comparison.
The reference identifies the evidence and its analytical purpose; the next sentence should interpret how that evidence advances the argument.
Interpret the Pattern Instead of Repeating the Visual in Prose
Prose should explain what a visual pattern means rather than reproduce every value or label already visible in the table or figure.
Interpretation adds synthesis by connecting the observed pattern to its evidence basis and explaining its relevance to the analytical argument.
The prose may identify convergence, divergence, or a relationship across the evidence, but the wording should preserve any limitation or uncertainty that affects the inference.
Exact values need to be repeated only when they are necessary to support that interpretation.
What an interpretation must add
Observed pattern
Name the relevant convergence, divergence, contrast, or association instead of recounting every visible item.
Evidence basis
Identify the comparable findings, values, or relationships that support the interpretation.
Qualification
Retain uncertainty and explain when differences in context, methods, or comparability limit the inference.
Argumentative meaning
State why the qualified pattern matters to the review question and how it changes the analytical argument.
A weak description might merely state that several studies appear together in the same part of a figure; a stronger interpretation explains that the displayed convergence is consistent with a shared pattern while noting any contextual differences that limit that inference.
Similar distinctions between visual repetition and analytical synthesis can be examined in review article examples after the local pattern and its evidential basis have been established.
The interpretive version adds information gain because it explains the pattern's meaning, qualification, and argumentative relevance instead of restating what the reader can already see.
Verify That Each Table and Figure Is Necessary, Clear, and Self-Contained
Each table and figure should be necessary, clear, and sufficiently self-contained for its intended role in the review.
A necessary visual adds analytical value by improving comprehension, comparison, or synthesis in relation to the review question.
A clear visual presents accurate content with readable labels and consistent terminology, while a self-contained visual provides enough title, caption, labeling, or other context where appropriate for its meaning to be understood.
If removing the visual does not reduce comprehension, comparison, or synthesis, reconsider whether it is needed.
Visual quality depends on analytical value and accurate interpretation rather than quantity, aesthetics, or complexity.
The checks below evaluate whether each visual aligns with the review question, communicates its content accurately, remains interpretable, and avoids unnecessary duplication with prose.
A failed check should lead to a specific revision or, when the visual contributes no distinct value, removal.
Necessity: Does the table or figure improve comprehension, comparison, or synthesis? If not, integrate useful information elsewhere or omit the visual.
Review-question alignment: Does the visual support a question, comparison, pattern, or relationship relevant to the review question? If not, revise its analytical purpose or omit it.
Accuracy: Do the displayed values, categories, relationships, and other content accurately represent the reviewed evidence? If not, correct the content before retaining the visual.
Title or caption: Where a title or caption is appropriate, does it identify the visual's subject and provide the context needed for interpretation? If not, revise it for clarity.
Labels: Do labels identify the relevant variables, categories, groups, stages, or other elements without ambiguity? If not, clarify the labels.
Terminology: Is terminology consistent within the visual and with the synthesis it represents? If not, align equivalent terms while preserving meaningful distinctions in the evidence.
Readability: Can the visual's structure and relationships be followed without avoidable confusion? If not, simplify or reorganize the presentation while preserving necessary information.
Self-containment: Can the table or figure be understood with its title, caption, labels, legend, and other necessary context where applicable, without relying on prose to supply missing meaning? If not, add or clarify the required context.
Non-duplication: Does the visual add information or analytical function beyond what the prose already communicates? If it merely duplicates the prose, reduce the duplication or integrate the information into the more suitable form.
Analytical value: Does the visual have a clear interpretive purpose in the synthesis? If not, revise it to serve a specific analytical function or omit it. If the visual still adds no distinct analytical value after revision, simplify it, integrate its useful information elsewhere, or remove it.